

Many a times there are situations where two variables are related. For example, blood pressure and heart function, people’s mood and physical health etc. Such related variables are called correlated variables. Despite the wide use of the correlation analysis, there exist some limitations as well. This paper aims to describe the correlation analysis and its limitations in clinical trial data analysis.
Correlation Analysis is a statistical method that is used to discover the extent of linear relationship between the two variables. It may be noticed that in some cases, increase in value of one variable is associated with increase in value of other variable or decrease in value of one variable is associated with decrease in value of other variable. Correlation between these variables is said to be positive correlation.
On the other hand, in some situations, increase in value of one variable is accompanied by decrease in value of other variable or decrease in value of one variable is accompanied by increase in the other variable. Correlation between these variables is said to be negative correlation. Sometimes, there is no pattern or change in one variable is related to change in other variable, then we say that there is no linear correlation between these two variables. Probably, there will be some other form of correlation may exists between such variables like curvilinear relationship or nonlinear relationship.
Pearson’s Correlation Analysis and Spearman’s Rank Correlation Analysis are the two most widely used correlation analyses depending on the type of data researchers have to handle. If data follows a normal distribution, then Pearson’s correlation analysis will be used, otherwise Spearman Rank correlation analysis will be used.
Following is the formula for Pearson’s correlation analysis:

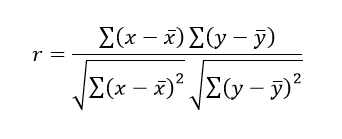
Where, x̄ is the mean of x variable and ȳ is the mean of y variable, r is the correlation coefficient which varies from -1 to +1. If r value is +1, then a positive perfect correlation exists between two variables. If r value is -1, then a negative perfect correlation exists between two variables. If r value is 0, then there is no linear correlation exists between two variables. Here the required condition is that x and y are continuous variables and both variables follows normal distribution. In case both variables or any one of them not following normal distribution, then Spearman Rank correlation analysis is the alternative procedure for correlation analysis.
Following is the formula for Spearman’s rank correlation analysis:
![]() Where, n is the number of observations di is the difference in ranks between x and y variables and r is the correlation coefficient, which varies from -1 to +1. If r value is +1, then a positive perfect correlation exists between two variables. If r value is -1, then a negative perfect correlation exists between two variables. If r value is 0, then there is no correlation exists between two variables.
Where, n is the number of observations di is the difference in ranks between x and y variables and r is the correlation coefficient, which varies from -1 to +1. If r value is +1, then a positive perfect correlation exists between two variables. If r value is -1, then a negative perfect correlation exists between two variables. If r value is 0, then there is no correlation exists between two variables.
There are certain limitations for correlation analysis in clinical trial data analysis. In clinical trials, the researchers have the tendency to look for the relationships between variables. As a starting point, they need to identify the variables to be correlated. These variables should have some relationship exists biologically or medically. Such variables only should be subjected for correlation analysis. Otherwise some spurious relationship will emerge from this analysis. Next step is to check for the normality assumptions and based on that whether Pearson’s correlation analysis or Spearman’s rank correlation analysis to be done. However, researcher needs to make sure that the variables are continuous in nature. Do not try to correlate the categorical variables like gender (male / female), severity of side effect (mild / moderate / severe) etc. from the clinical trial data. Another limitation is that it is not possible to attribute the causation to these two correlated variables. Simply we can say that they are related and it is positive or negative relationship based on the sign of correlation coefficient (r).
It is a good practice to inspect a scatterplot of the observations before calculating a correlation coefficient in order to assess whether the data could possibly be described with a linear association and whether calculating a correlation coefficient makes sense.
To summarize, calculating the correlation coefficient is an easiest method for getting an idea about the relationship between two variables in clinical trial data analysis. However, one should be aware of all these limitations while interpreting the results of correlation analysis. If necessary, researchers should consult the experienced statistician for further guidance.
