Medical Devices
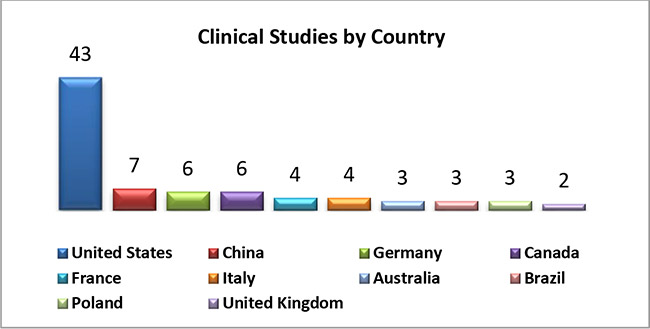
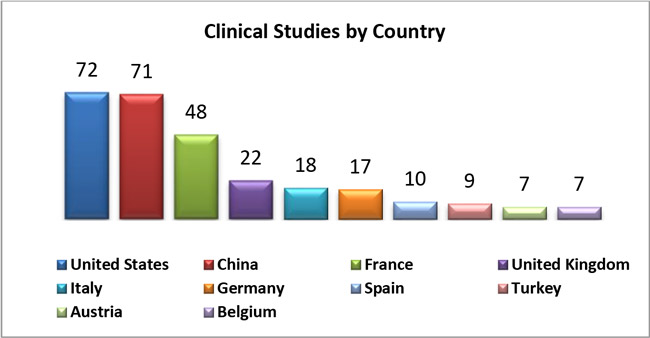
1. Based on number of clinical studies conducted on devices in each country, below shows TOP 10 countries:
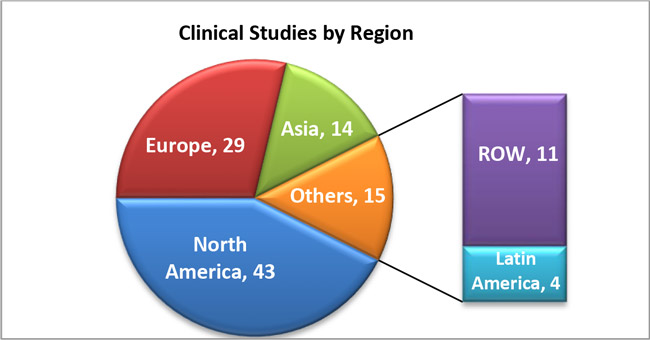
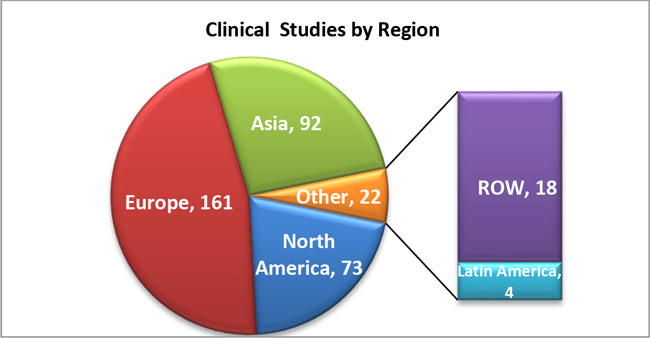
2. COVID-19 clinical studies by region
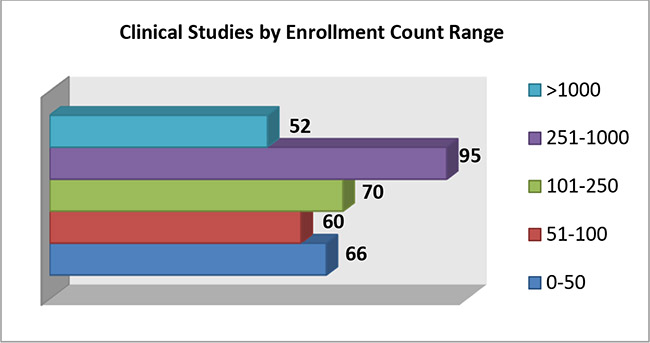
3. The following graph shows the decrease in number of COVID-19 Studies conducted on devices with increase in enrollment count
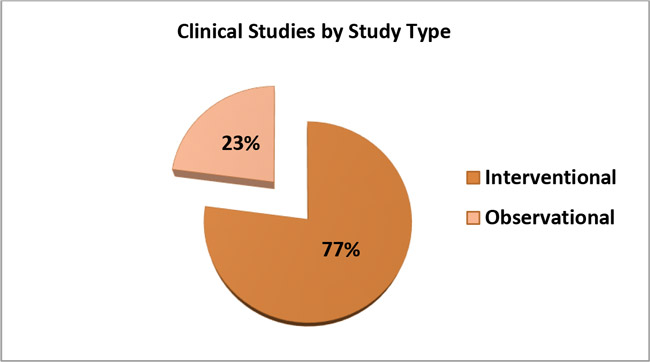
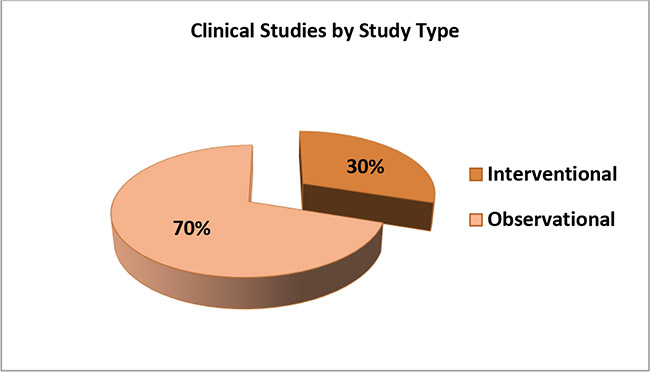
4. The following graph shows the percentage of interventional versus observational COVID-19 Clinical Studies conducted on devices
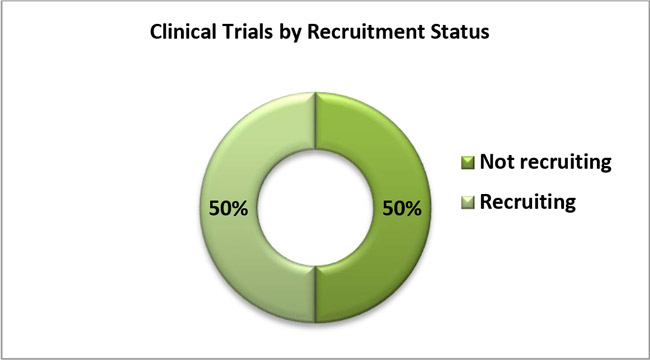
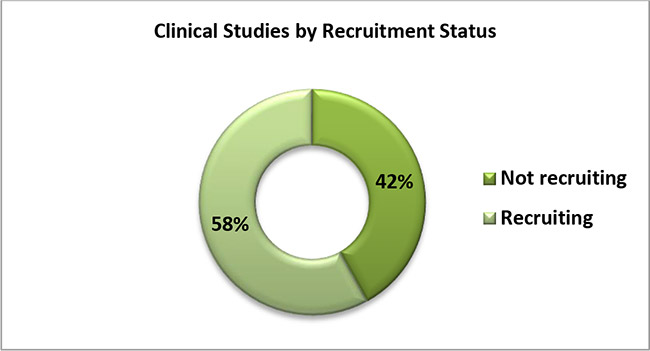
5. The following graph shows the percentage of COVID-19 Clinical Studies conducted on devices by recruitment status
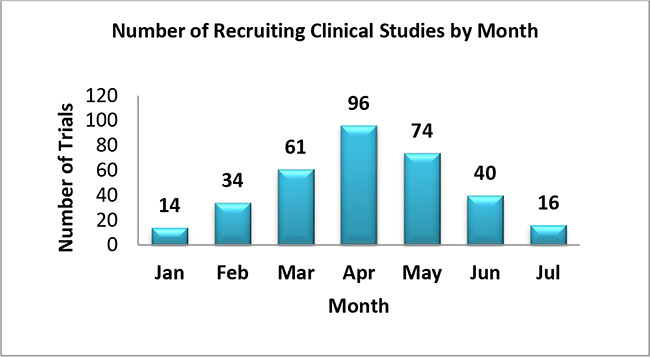
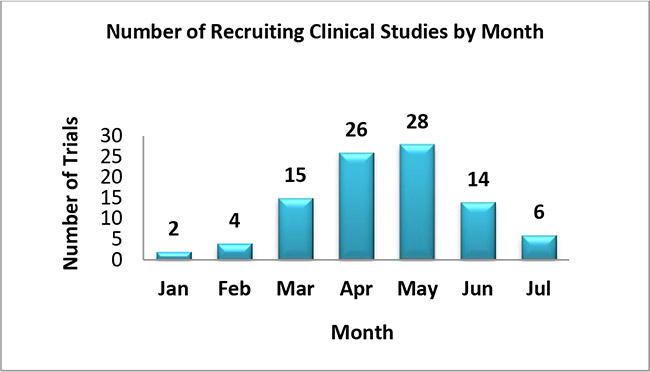
6. The following graph shows monthly count of COVID-19 device Studies which have initiated the patient enrollment
Diagnostics
1. Based on the number of Clinical Studies conducted on diagnostics in each country, here is the graph showing top 10 countries with trial count:
2. The following graph shows the number of COVID-19 Clinical Studies on diagnostics by region
3. The following graph shows the decrease in number of COVID-19 Studies conducted on diagnostics with increase in enrollment count
4. The following graph shows percentage of interventional versus observational COVID-19 Studies conducted on diagnostics
5. The following graph shows the percentage of COVID-19 Studies conducted on diagnostics by recruitment status
6. The following graph shows monthly count of COVID-19 diagnostic Studies which have initiated the patient enrollment